
Creating Effective KPI Dashboards That Drive Action
October 21, 2026
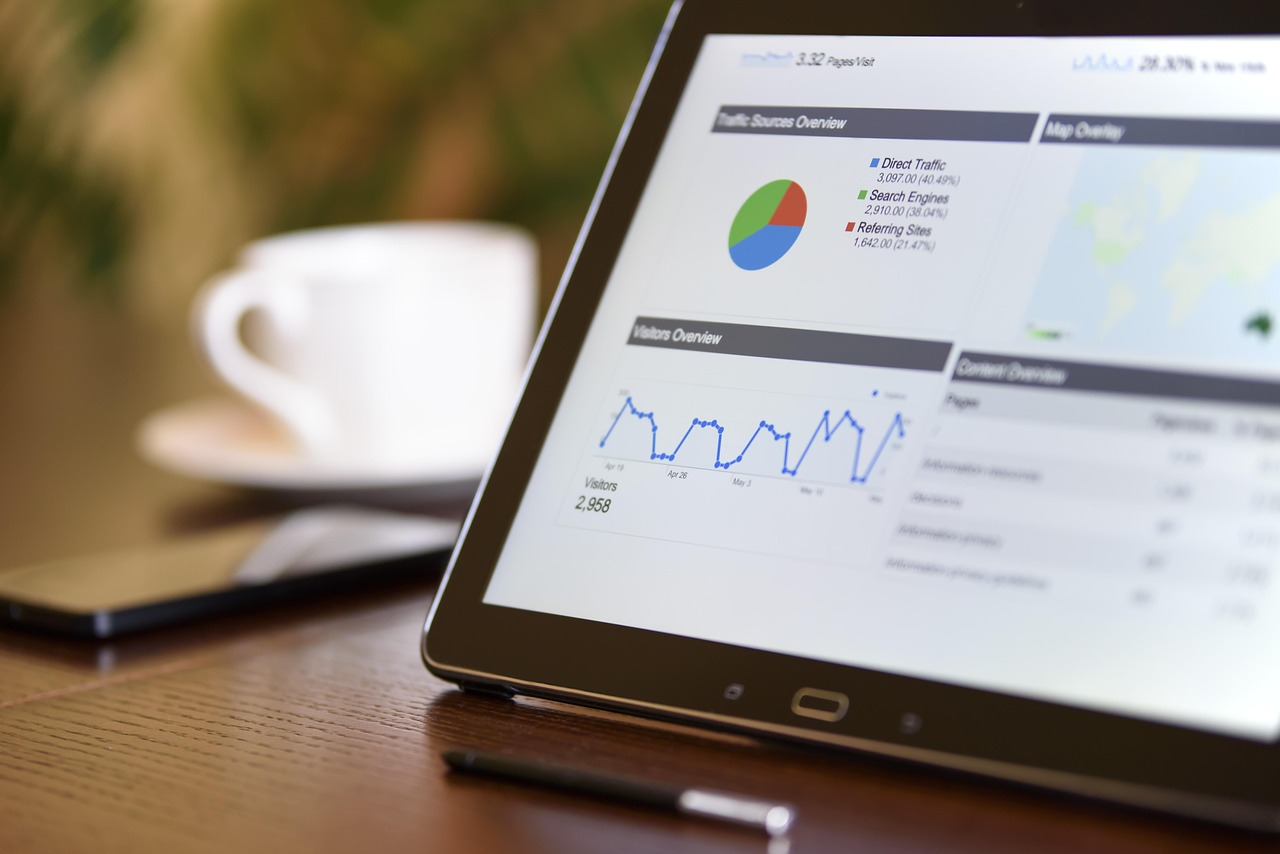
Understanding the Importance of KPI Dashboards
KPI dashboards are essential tools for monitoring the health and performance of a business. When designed effectively, they provide actionable insights that help founders and operators make informed decisions. However, the challenge often lies in creating dashboards that actually get read and drive team action.
Why KPI Dashboards Often Fail
Many dashboards are cluttered with vanity metrics or too much data, making them overwhelming and ineffective. A good dashboard should be concise, focused, and relevant to the business goals. It should highlight the metrics that truly matter, facilitating quick and decisive actions.
A Framework for Creating Effective KPI Dashboards
Creating a KPI dashboard that drives action requires a strategic approach. Here’s a repeatable framework to guide you:
1. Define Your Objectives
Begin by clearly defining what you want to achieve with your dashboard. Are you looking to boost sales, improve customer service, or enhance operational efficiency? Defining your objectives will guide your choice of metrics.
- Action Step: Conduct a goal-setting session with your team to align on the primary business objectives.
2. Choose the Right KPIs
Not all metrics are created equal. Focus on KPIs that align directly with your business objectives.
-
Sales-Oriented KPIs: Conversion rate, average order value.
-
Customer Service KPIs: Net promoter score (NPS), first response time.
-
Operational KPIs: Process time, error rate.
-
Action Step: Develop a shortlist of KPIs that reflect your core objectives. Limit the dashboard to 5-7 key indicators to maintain focus.
3. Design for Clarity
The design of your dashboard impacts how effectively it communicates information. A cluttered interface can obscure insights and hinder decision-making.
- Action Step: Use clean, simple layouts. Leverage visual hierarchy to ensure the most critical information stands out.
4. Implement Real-Time Data
Ensure your dashboard is updated with real-time data to provide accurate insights. This helps in making timely decisions that can have a significant impact on performance.
- Action Step: Integrate data sources that automatically update, eliminating the need for manual entry and potential errors.
5. Foster a Data-Driven Culture
Encourage your team to rely on data from the dashboard for decision-making processes. This reinforces the significance of the dashboard in your operations.
- Action Step: Schedule regular meetings to discuss dashboard insights and adjust strategies as needed.
6. Iterate and Improve
KPI dashboards are not static. Regularly review and refine your metrics and design to ensure they continue to serve your evolving business needs.
- Action Step: Set a quarterly review of your dashboard's performance and its relevance to current business goals.
The Role of an AI Chief of Staff
Tools like Badtool can streamline the process of KPI reporting by automating data collection and analysis. This ensures your dashboard is always up to date and allows you to focus on strategic decision-making.
By leveraging AI, you can:
- Automate Data Management: Ensure accurate and timely data feeds.
- Enhance Analysis: Use machine learning to uncover trends and insights that may not be immediately apparent.
- Simplify Reporting: Receive daily summaries that keep your team informed without overwhelming them.
Conclusion
Creating an effective KPI dashboard is about clarity, relevance, and actionability. By following this framework, you can design dashboards that not only get read but drive meaningful action in your team. With the right tools and processes, KPI dashboards can transform how you manage and grow your business.