
Creating an Effective KPI Dashboard for Small Teams
November 9, 2026
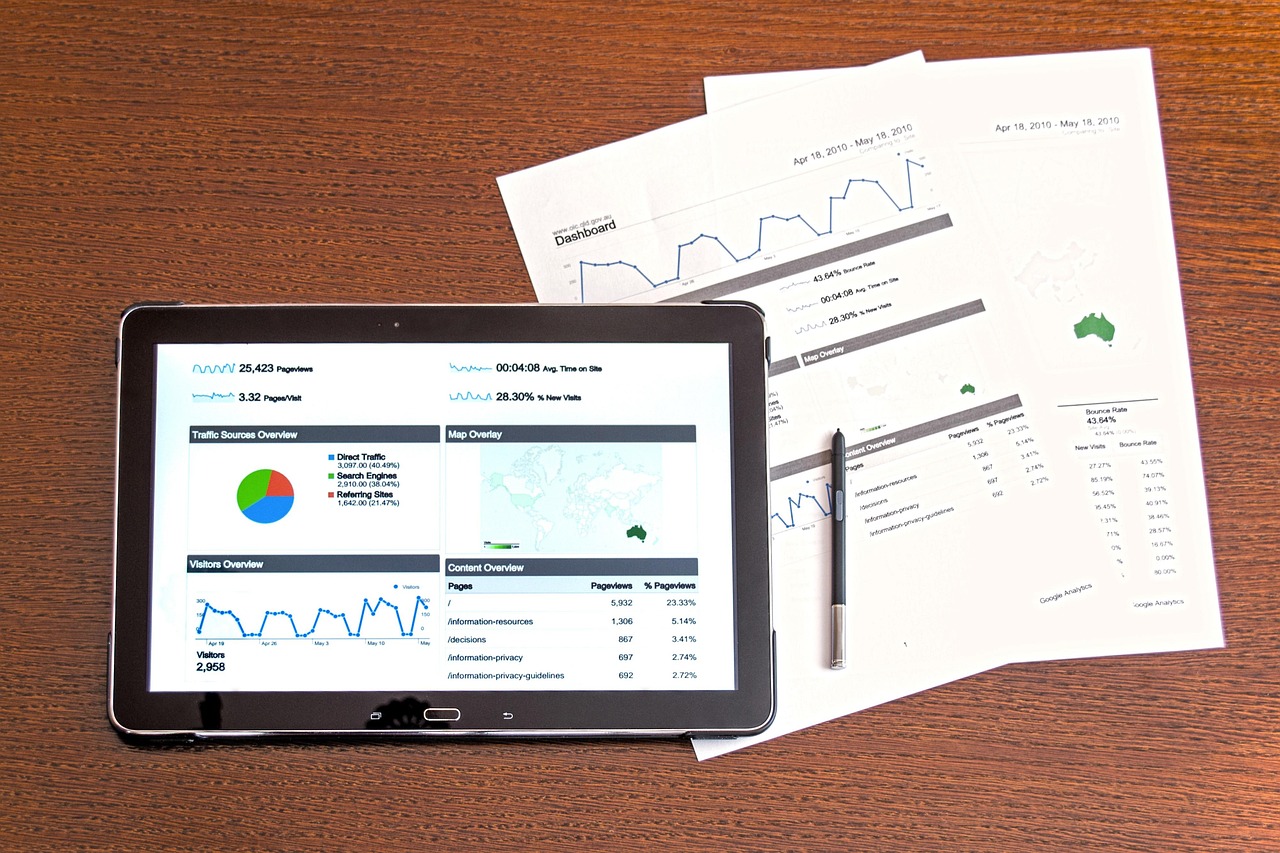
Why KPI Dashboards Matter for Small Teams
Building an effective KPI dashboard is crucial for small teams aiming to stay aligned, focused, and productive. A well-crafted dashboard serves as a lighthouse, offering clarity and driving decisions based on data. However, crafting a dashboard that genuinely adds value requires more than just pulling numbers into a sheet and calling it a day.
Small teams often face specific challenges in the selection and presentation of KPIs. These include:
- Resource Constraints: With lean operations, there’s limited time and tools for data handling.
- Diverse Roles: Team members may juggle multiple roles, needing clear insights to prioritize effectively.
- Rapid Changes: Agile environments require dashboards that can quickly adapt to new strategic directions.
The Framework for Building Effective KPI Dashboards
To build a dashboard that serves your team’s needs, follow this step-by-step framework:
1. Define Clear Objectives
Start with the end in mind. What do you hope to achieve with your KPI dashboard? Common objectives include:
- Tracking progress towards strategic goals.
- Identifying bottlenecks in processes.
- Enhancing accountability among team members.
By identifying the primary purpose, you can ensure each KPI directly supports team and organizational goals.
2. Select Relevant KPIs
Choosing the right KPIs can make or break your dashboard’s utility. Follow these guidelines:
- Align with Objectives: Each KPI should map directly to your defined objectives.
- Keep It Simple: Focus on quality over quantity. Prioritize a few critical metrics that are easily understandable.
- Make It Actionable: Every KPI should drive action or decision-making.
3. Choose the Right Tools
Consider tools that integrate seamlessly with your existing workflows. Popular options include:
- Google Data Studio: Easy to use with Google Analytics.
- Tableau: Offers powerful visualization capabilities.
- Airtable: Combines database functionality with visualization.
4. Design for Clarity
The presentation of your dashboard is just as important as the data it contains. Consider these design principles:
- Use Visual Hierarchies: Arrange KPIs in order of importance, using size and color to guide the viewer’s eye.
- Maintain Consistency: Use consistent colors and fonts to avoid cognitive overload.
- Limit Distractions: Avoid unnecessary graphics that don't add value.
5. Implement Feedback Loops
A dashboard should evolve with your team’s needs. Implement feedback mechanisms to refine your approach:
- Regular Reviews: Schedule monthly sessions to assess the dashboard’s relevance and accuracy.
- Solicit Team Feedback: Encourage team members to suggest improvements based on their experiences.
Leveraging AI for Smarter KPI Dashboards
Adopting an AI Chief of Staff, like Badtool, can streamline the development and maintenance of your KPI dashboards. By automating data collection and analysis, AI tools can reduce the manual work involved and increase the accuracy of data displayed.
How AI Helps:
- Automated Data Collection: AI pulls data from various sources, ensuring dashboards are always up-to-date.
- Predictive Analysis: Smart algorithms can forecast trends, providing insights beyond current data.
- Personalized Reporting: AI can tailor dashboard views to different team roles, focusing on what matters most to each member.
Conclusion
An effective KPI dashboard is not just a collection of numbers but a dynamic tool that drives your team towards its goals. By following this structured framework, small teams can create dashboards that not only inform but also empower action and alignment across the organization. As you refine your approach, consider leveraging AI solutions like Badtool to further enhance efficiency and efficacy in your KPI reporting efforts.